|
Data on Minnesota Exports for First Quarter 2023 – Published May 2023 |
- Minnesota exports of goods (including agricultural, mining and manufactured products) were valued at $6.6 billion in the first quarter of 2023, representing a gain of 9% (or up $519 million) over the first quarter of 2022. This was the eighth consecutive quarter of export growth.
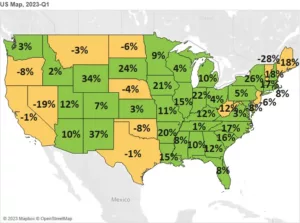
- S. exports of goods rose 7% during the first quarter, with 37 states and Washington D.C. having positive export growth rates over the first quarter of 2022.
- Minnesota’s manufactured exports jumped over 11% to $6.1 billion in the first quarter of 2023, while U.S. manufactured exports were up 6%.

Figure 1. Exports Grow from 37 States (MN: +9%; US: +7%)
Widespread Export Growth Across Regions – Fueled by North American Markets
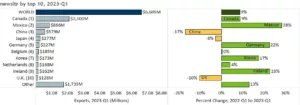
- Minnesota’s exports increased 14% to North America – driven by both Mexico (up 28%) and Canada (up 9%).
- Exports grew strongly to the European Union (up 15%) – led by Germany (up 22%), Ireland (up 23%) and Spain (up 80%); to the Caribbean, Central and South America (up 28%) – boosted by Costa Rica (up 50%) and Brazil (up 25%); to the Australia-Pacific region (up 12%) – bolstered by Australia (up 15%); and to Africa (up 34%) – as wheat exports surged by $15 million to Ethiopia.
- State exports dropped 5% to Asia, dragged down by large declines to China (down 17%) and Singapore (down 12%) that outweighed strong strides made in Malaysia (up 31%), Korea (up 17%) and Vietnam (up 30%).
- Exports to Russia plummeted $10 million (down 94%), while those to Ukraine jumped 175% to $21 million.
Figure 2. Export Trends for Minnesota’s Top 10 Markets, First Quarter 2023
Mineral Fuel and Oil; Optic and Medical Products; and Vehicles Lead in Export Gains
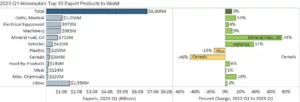
- Exports of core products performed strongly into 2023, including eight of the state’s top 10 products. Gains were led by mineral fuel, oil (up 74%), optic, medical (up 14%), vehicles (up 37%), machinery (up 9%) and oil seeds, misc. grain (up 127%).
- Exports of mineral fuel, oil (up 74%) were propelled by Canada, the dominant market.
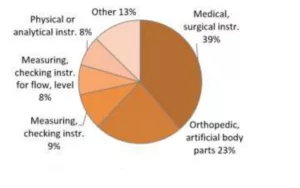
- Optic, medical exports grew in Belgium (50%), Costa Rica (up 64%) and the Netherlands (up 40%) but tumbled in China (down 23%). Orthopedic, artificial body parts ($245 million, up 73%) drove growth.
 Figure 3. Optic and Medical Product Segments
- Vehicle sales were primarily driven by Mexico ($138 million, up 80%) and Canada ($190 million, up 34%). Leading growth segments included vehicle parts ($151 million, up 56%) and vehicles for 10+ passengers ($18 million, up 317%). Tanks, armored vehicles ($22 million, up 840%) fueled growth to Ukraine ($19 million, up from $20,000)
- Sales of machinery (up 9%) rallied, with strong gains to North American markets (up 19%), China (up 25%) and the Middle East (up 133%; especially to Saudi Arabia and UAE), despite steep declines to the Philippines and Italy.
- Export growth in oil seeds, misc. grain (up 127%) was largely generated by demand for soybeans in Mexico.
- While demand for cereals increased strongly in Mexico ($120 million, up from $6 million; due to growth in corn and wheat), it plunged 82% (or was down $278 million) in Canada.
- Electrical equipment exports were spurred by Malaysia (up 107%), Germany (up 35%) and the Philippines (up 126%). Growth segments such as diodes, transistors (up 37%), electric furnaces (up 105%) and batteries (up 32%) helped offset declines in integrated circuits (down 13%) and insulated wire, cable (down 18%).
- Korea (up $11 million), Germany (up $7 million) and Portugal (up $6 million) uplifted aircraft sales (up 8%).
Figure 4. Export Trends for Minnesota’s Top 10 Products, First Quarter 2023
| Minnesota Export Statistics reports track the state’s trends in exports of goods and is prepared for the Minnesota Trade Office by DEED’s Economic Analysis Unit (Thu-Mai Ho-Kim). The quarterly and annual reports primarily cover export data based on the Harmonized Tariff System (Schedule B), collected by the Foreign Trade Division, Census Bureau, U.S. Dept of Commerce and accessed through USA Trade Online (Census Bureau) and Trade Data Monitor (TDM). Historical reports are available on DEED’s website at “Export and Trade Statistics” (http://mn.gov/deed/data/export-stats/). |


