

Annual Data on Minnesota Manufactured Exports – Published in March 2024
For More Information: Mary Haugen ([email protected])
- Minnesota exported about $25 billion in agricultural, mining and manufactured goods to nearly 200 countries in 2023. Minnesota had the 23rd highest in export value among all states.
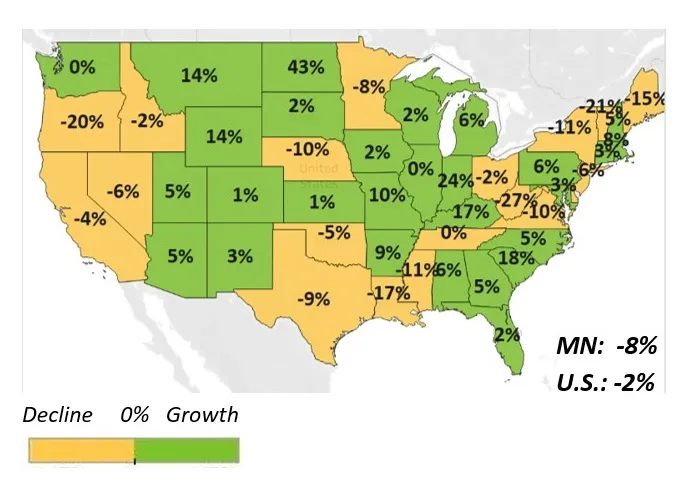
- The state’s exports fell an overall 8% between 2022 and 2023. Mineral fuel and oil exports drove the decline, reflecting the impact of falling energy prices combined with decreased demand. Absent the mineral fuel, oil trend, overall state exports would have been flat.
- S. exports decreased 2% between 2022 and 2023. Although exports from fewer than half of states declined, those from the four largest states (TX, CA, LA, NY) slid considerably.
Figure 1. Mixed Export Trends Across States
- An estimated over 8,300 Minnesota exporters of goods and services supported about 117,900 jobs in 2021.
Demand Weakened in Markets in North America and Asia
- Under constrained global economic conditions, Minnesota exports reversed their growth streak of 2022.
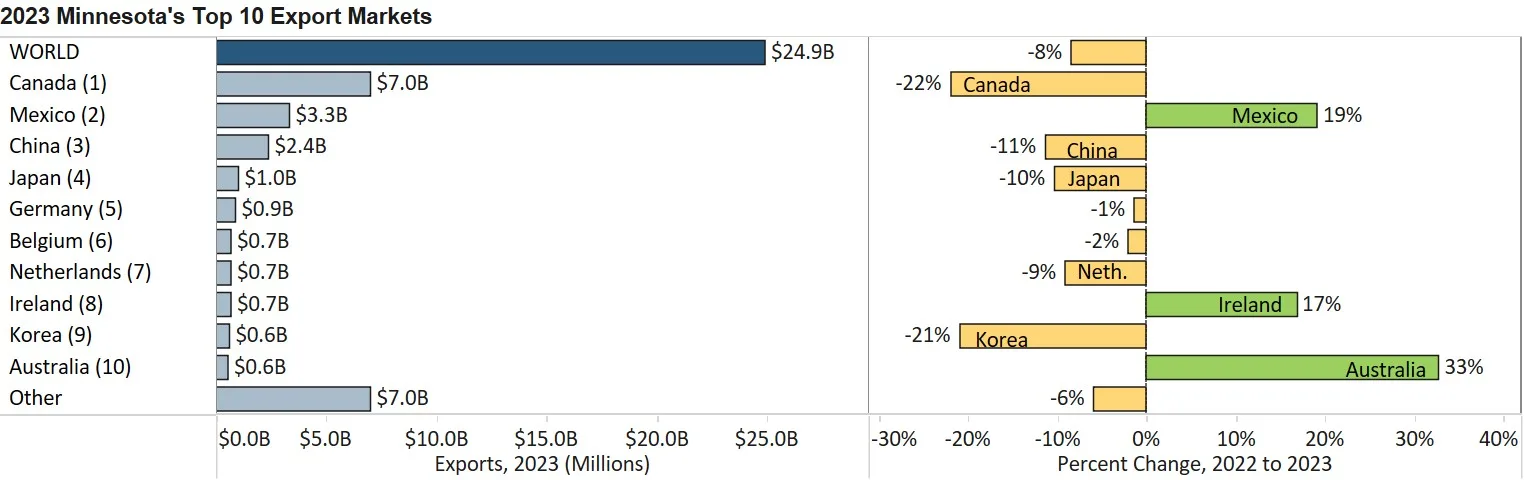
- Exports to North America slipped to $10.4 billion, dropping $1.4 billion in value (or down 12%) since 2022. Exports also slumped to Asia ($6.4 billion, down 13%) and the European Union ($4.4 billion, down 7%).
- The state’s exporters found promising growth opportunities in the Caribbean, Central America and South America ($1.3 billion, up 14%), the Australia-Pacific region ($619 million, up 26%) and Africa ($262 million, up 41%). Sales also edged up in the Middle East (up 4%) and European markets outside the EU (up 3%).
- Mexico, Australia, Ireland, Saudi Arabia, and Chile generated the largest export gains per market in 2023.
Figure 2. Exports to Minnesota’s Top 10 Markets in 2023
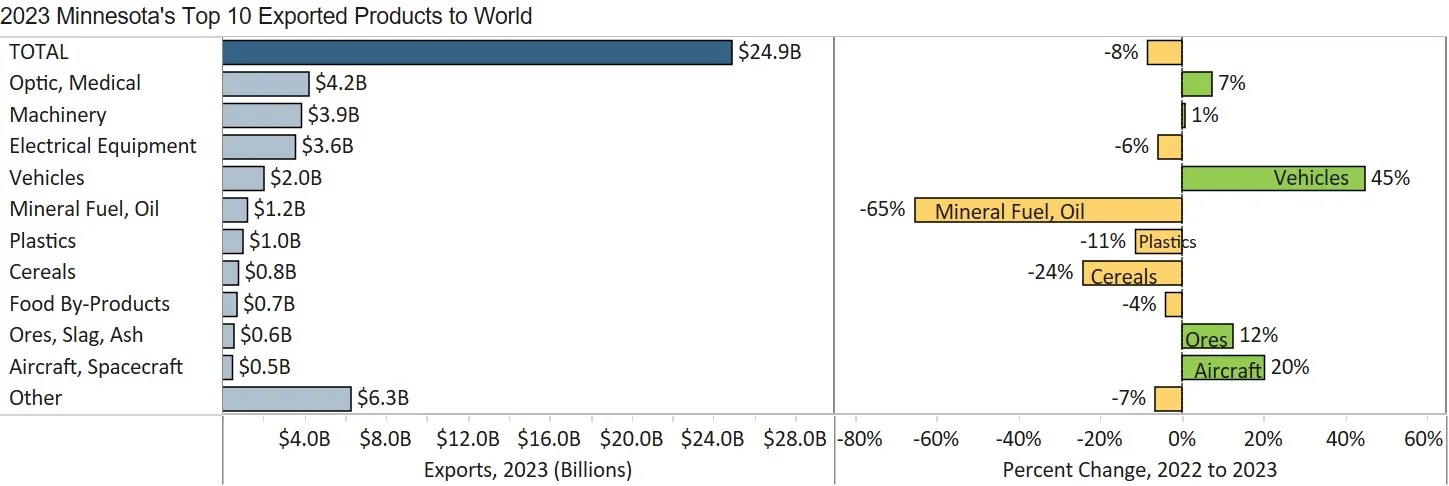
Growth in Vehicles, Optic & Medical, Aircraft & Spacecraft Help Bolster Exports
- Vehicles (up $634 million), optic, medical (up $291 million) and aircraft, spacecraft (up $92 million) offered bright spots of surging demand.
- The 65% decrease in mineral fuel, oil represented a loss of $2.3 billion in exports and was driven by Canada. It was the underlying source of the state’s decrease in total exports.
- Vehicles exports grew 45% to over $2 billion. Canada (up 45%) and Mexico (up 30%) largely fueled growth. Australia, Ukraine, Saudi Arabia and UAE also contributed significantly to growth.
Figure 3. Optic, Medical Exports, by Segment
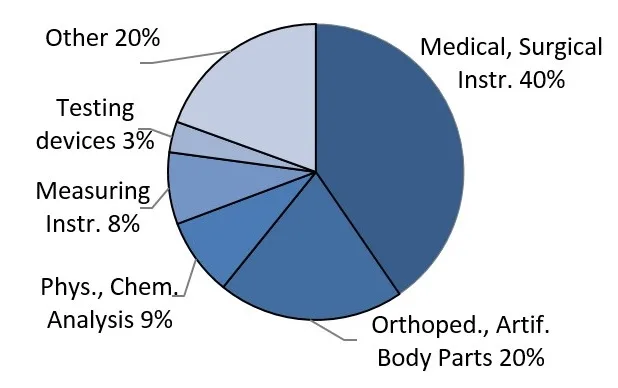
- Exports of optical, medical goods grew a solid 7%. Markets such as Ireland, Belgium, Canada, Costa Rica and Korea led in gains. Key growth products included medical, surgical and analytical instruments.
- Germany ($84 million, up 107%), Japan ($27 million, up 1,107%) and Canada ($50 million, up 62%) lifted sales of aircraft, spacecraft. Critical expanding segments were civilian aircraft and aircraft parts.
- The dominant market, Canada ($544 million, up 9%) – as well as Japan ($23 million, up 131%) – drove increased demand for ores, slag, ash products, which consist of iron ores and concentrates for Minnesota.
- Italy ($79 million, up 53%) and China ($236 million, up 8%) spurred growth in chemicals ($499 million, up 9%). A large majority consists of composite diagnostic or lab reagents ($400 million, up 14%).
- Trends in machinery exports were mixed, as sales surged to Mexico (up 15%), Chile (up 340%), Canada (up 7%), and Saudi Arabia (up 294%) but sank to China, the Philippines and
- Oil seeds, misc. grains ($298 million, up 28%) leaped to Mexico ($135 million, up 136%). Other agricultural and food products with robust growth were vegetables ($105 million, up 62%), prepared cereal, flour ($180 million, up 21%), milling goods ($74 million, up 35%) and sugar, confectionary ($94 million, up 23%).
Figure 4. Exports of Minnesota’s Top 10 Products in 2023
|
Minnesota Export Statistics tracks the state’s trends in exports of goods and is prepared for the Minnesota Trade Office by DEED’s Economic Analysis Unit (by Thu-Mai Ho-Kim). The quarterly and annual reports primarily cover export data based on the Harmonized Tariff System (Schedule B), collected by the Foreign Trade Division, Census Bureau, U.S. Dept of Commerce and accessed through USA Trade Online (Census Bureau) and Trade Data Monitor (TDM). Historical reports are available on DEED’s website at “Export and Trade Statistics” (http://mn.gov/deed/data/export-stats/). The U.S. Department of Agriculture (USDA) publishes alternate agricultural export data based on different methodology. USDA estimated that Minnesota exported $10 billion in ag and food products in 2022 and ranked 4th highest among states. The International Trade Administration estimates jobs supported by U.S. exports of goods and services, while the Census Bureau collects data on the number of identified exporters. Export data on services industries are limited; in 2021, Minnesota’s services exports were estimated at $12 billion by the Coalition of Services Industries. |