

Data on Minnesota Exports for Third Quarter 2023 – Published December 2023
For More Information: Mary Haugen ([email protected])
Drop in Mineral Fuel and Oil Exports Drives State Exports Down 17%
- Minnesota exports of goods (including agricultural, mining and manufactured products) were valued at $6.1 billion in the third quarter of 2023, representing a drop of 17% (or down $1.3 billion) over the third quarter of 2022.
- S. exports of goods fell 6% in the third quarter, as exports from 30 states declined between the third quarters of 2022 and 2023.
- For the year to date, state exports slipped 6.6% between 2022 and 2023, compared to a drop of 2.5% for the nation.
- Minnesota’s manufactured exports slid 16% to $5.3 billion in the third quarter of 2023, while U.S. manufactured exports fell 3%.
Figure 1. Exports Declined from 30 States
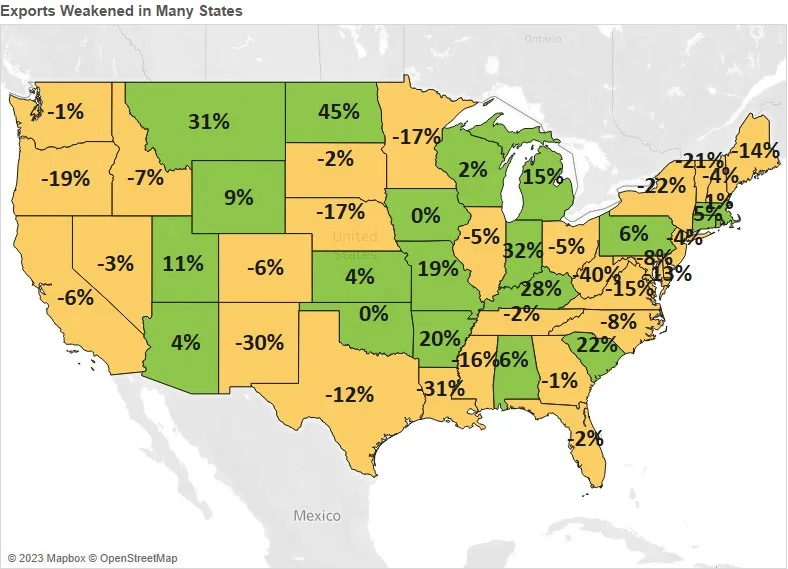 |
MN: -17% U.S.: -6% |
| Decline 0% Growth |
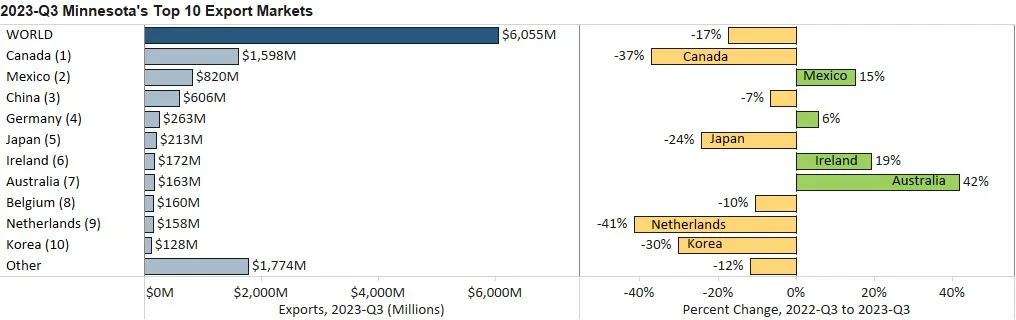
Strong Growth to Latin American Markets and Australia, Amid Widespread Decline
- Minnesota’s exports dropped sharply to North America ($2.4 billion, down 26%), despite solid growth to Mexico (up 15%). Sales plunged to Canada (down 37%), driven by mineral fuel, oil (down $895 million, a category that includes motor fuel products).
- Demand tumbled across Asia ($1.6 billion, down 18%) as demand weakened, especially in Japan, Taiwan, Korea and China. The Philippines (up 25%) and Malaysia (up 6%) were isolated in their strong performances.
- Exports also fell to the European Union (down 18%), the Middle East (down 12%) and Africa (down 7%).
- Growing markets in the Caribbean, Central and South America ($407 million, up 41%) and Australia ($163 million, up 42%; the state’s 7th largest market) helped bolster state exports.
Figure 2. Export Trends for Minnesota’s Top 10 Markets, Third Quarter 2023
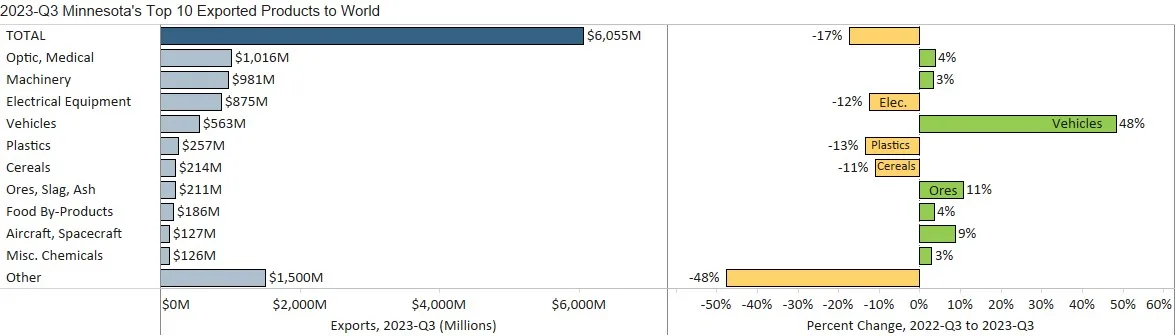
Gains in Vehicles, Optic/Medical, Machinery and Ores Help Sustain Exports
- Despite widespread decline, some key products performed moderately well, to strongly well, in the third quarter – led by vehicles (up 48%), optic, medical products (up 4%), machinery (up 3%), ores, slag, ash (up 11%) and aircraft, spacecraft (up 9%).
- Sales of mineral fuel, oil sank $1.1 billion (down 91%) to $114 million. These exports fell sharply to Canada (down 98%, the dominant market) – as well as to the Netherlands, Spain, and Lithuania – but jumped $54 million to Germany.
- Electrical equipment (down 12%), meat (down 40%) and fertilizers (down 59%) also tumbled.
Figure 3. Minnesota Exports of Vehicles
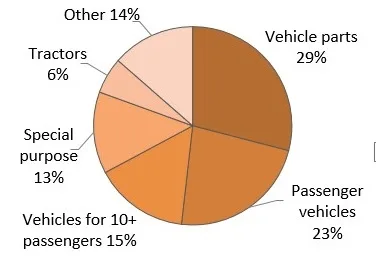
- Sales of vehicles gained traction in Canada (up 48%), Mexico (up 22%), Australia (up 397%) and Brazil (up 993%). The strongest segments included large passenger vehicles, special purpose vehicles and tractors.
- Optic, medical goods swelled in Costa Rica (up $17 million), Ireland (up $12 million), Turkey (up $9 million), France (up $9 million) but buckled to Taiwan (down 40%) and Belgium (down 15%). Global demand surged for medical, surgical instruments (up 12%) and instruments for physical and chemical analysis (up 34%).
- Machinery exporters made strong inroads in Chile ($74 million, up 1,240%), Saudi Arabia ($19 million, up 464%) and Turkey ($7 million, up 208%) – offsetting large declines in Asia, such as in Korea, Singapore, China and the Philippines. Leading segments included centrifuges and filters (up 14%) and specialized machinery (up 56%).
- Canada (up 7%) – with a market share of 97% – lifted exports of ores, slag, ash (mainly iron ores).
- Top markets for aircraft, spacecraft boosted exports: Mexico (up 67%), the U.K. (up 63%) and Germany (up 19%).
- Glucose products sold to Mexico (up $8 million) propelled sugar, confectionary sales ($25 million, up 45%).
- Robust sales of cereals to Mexico (up $68 million) offset downward trends in Canada, Indonesia and
- Integrated circuits (down 26%) and electric generators (down 36%) impacted electrical equipment the most.
Figure 4. Export Trends for Minnesota’s Top 10 Products, Third Quarter 2023
| Minnesota Export Statistics reports track the state’s trends in exports of goods and is prepared for the Minnesota Trade Office by DEED’s Economic Analysis Unit (Thu-Mai Ho-Kim). The quarterly and annual reports primarily cover export data based on the Harmonized Tariff System (Schedule B), collected by the Foreign Trade Division, Census Bureau, U.S. Dept of Commerce and accessed through USA Trade Online (Census Bureau) and Trade Data Monitor (TDM). Historical reports are available on DEED’s website at “Export and Trade Statistics” (http://mn.gov/deed/data/export-stats/). |