
By ABBY BUDIMAN, JEFFREY S. PASSEL AND CAROLYNE IM,
Pew Research Center
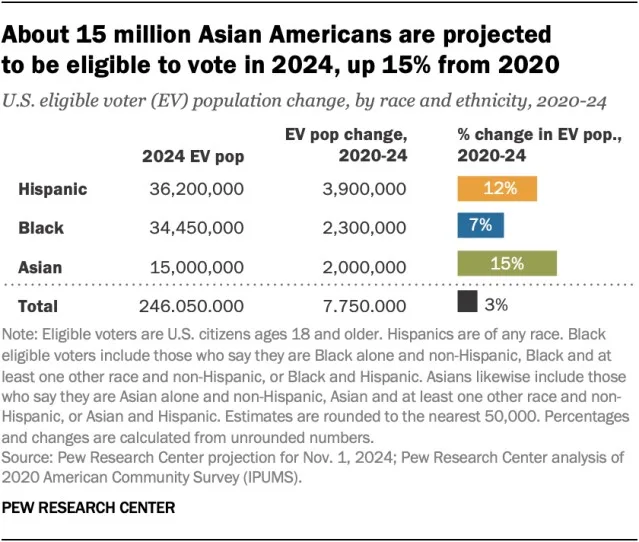
Asian Americans have been the fastest-growing group of eligible voters in the United States over roughly the past two decades and since 2020. Their number has grown by 15%, or about 2 million eligible voters, in the past four years. That’s faster than the 3% growth rate for all eligible voters during that span and the 12% for Hispanic eligible voters.
Asian Americans typically lean Democratic. In 2020, 72% of English-speaking, single-race, non-Hispanic Asian voters said they voted for Democrat Joe Biden for president, while 28% said they voted for Republican Donald Trump, according to a Pew Research Center analysis of validated voters.
As the 2024 presidential election approaches, here are six key facts about Asian American eligible voters in the U.S., based on our own projections for 2024, as well as Census Bureau data for previous years. (Eligible voters in this analysis are defined as citizens ages 18 and older residing in the 50 states and the District of Columbia. Not all eligible voters are actually registered to vote. Detailed demographic information about Asian American eligible voters is available in the drop-down box at the bottom of this post.)
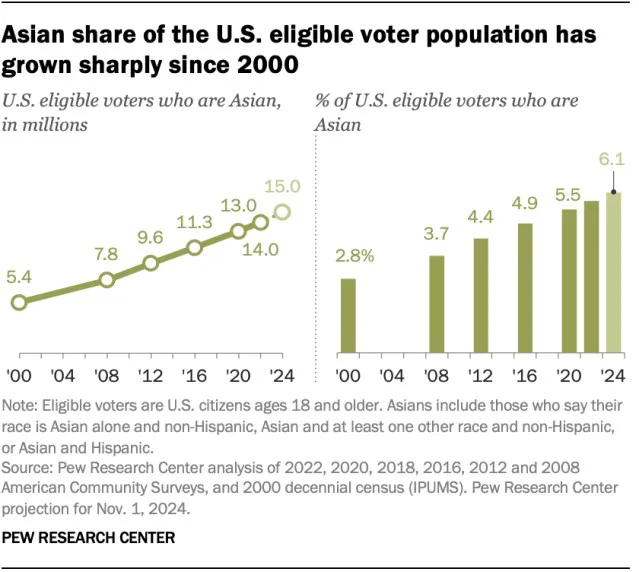
This November, a projected 15.0 million Asian Americans will be eligible to vote, making up just 6.1% of all eligible voters, according to Pew Research Center projections. However, the number of Asian American eligible voters and their share of the U.S. eligible voter population increased substantially between 2020 and this year, according to our projections. (Between 2000 and 2020, single-race, non-Hispanic Asian Americans made up the fastest-growing racial or ethnic group in the U.S. electorate.)
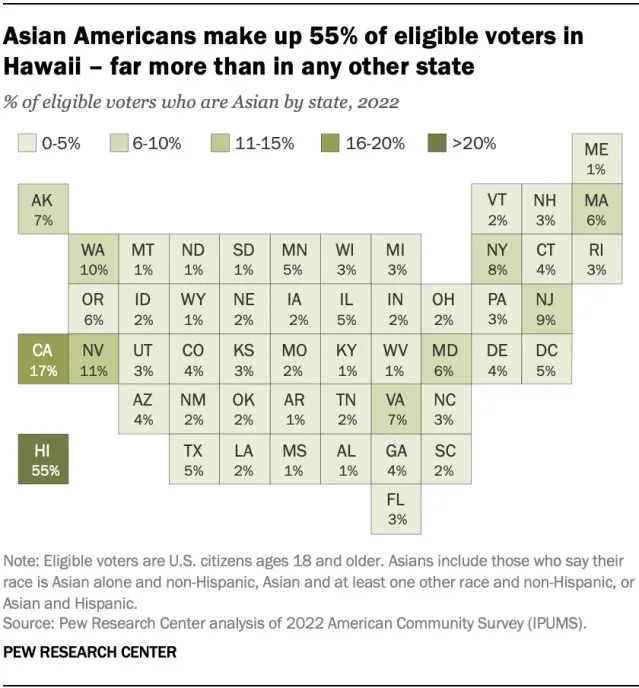
As of 2022, most Asian American eligible voters (55%) live in only five states. California has the highest number of Asian American eligible voters by far (4.4 million). The state is home to nearly a third (31%) of the entire U.S. Asian electorate. The states with the next-most Asian American eligible voters are New York (1.2 million), Texas (1.1 million), Hawaii (580,000) and New Jersey (575,000).
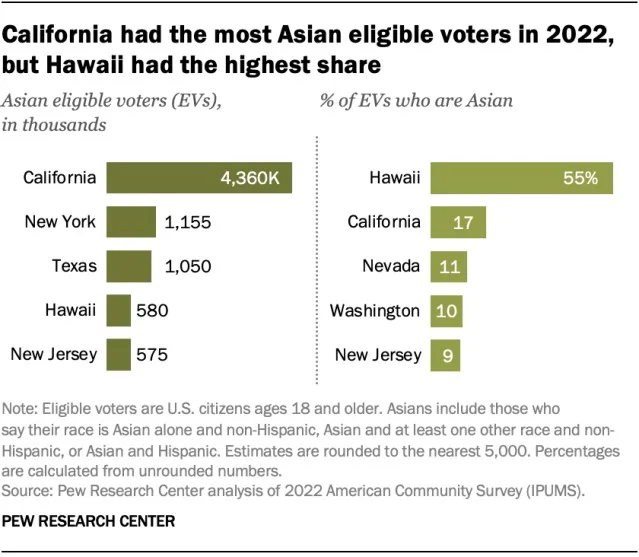
Hawaii is the only state where Asian Americans make up a majority of the eligible voter population. Asian Americans make up 55% of the electorate in Hawaii, the only state where a racial or ethnic group other than single-race White, non-Hispanic eligible voters are the majority. The states with the next-largest shares of Asian eligible voters are California (17%) and Nevada (11%).
Hawaii also has the highest share of Asians who are eligible to vote. About seven-in-ten Asians (71%) in the state are eligible to vote, the highest share of any state with an Asian population of 50,000 or more. Following Hawaii on this measure are Nevada (65%), Oregon (62%), California (62%) and Louisiana (60%).
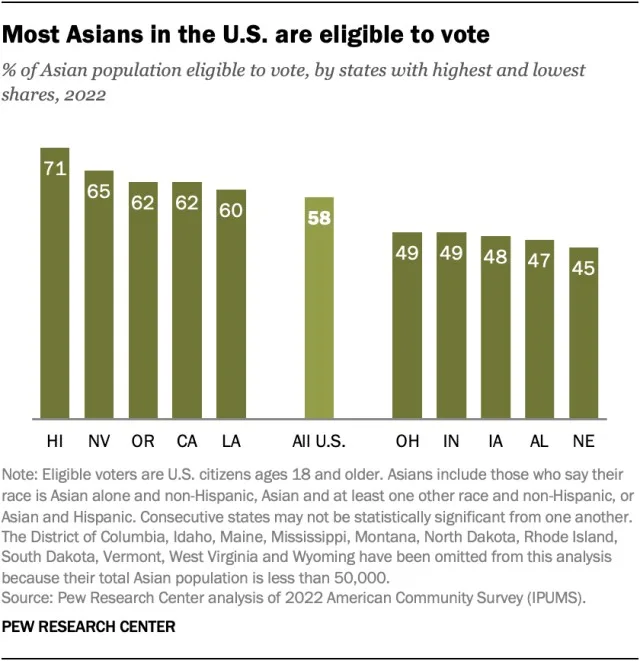
Overall, more than half of all Asian Americans in the U.S. (58%) are eligible to vote. By comparison, 72% of the total U.S. population is eligible.
Asian Americans are less likely than Americans overall to be eligible to vote because a significant share are immigrants who are not U.S. citizens. Asian immigrants who are not eligible to vote include permanent residents (green card holders) and those in the process of becoming permanent residents; those in the U.S. on temporary visas; and unauthorized immigrants.
A majority of Asian American eligible voters are naturalized citizens, not U.S.-born citizens. Asian Americans are the only major racial or ethnic group where more eligible voters are naturalized citizens than U.S.-born citizens (56% vs. 44%).
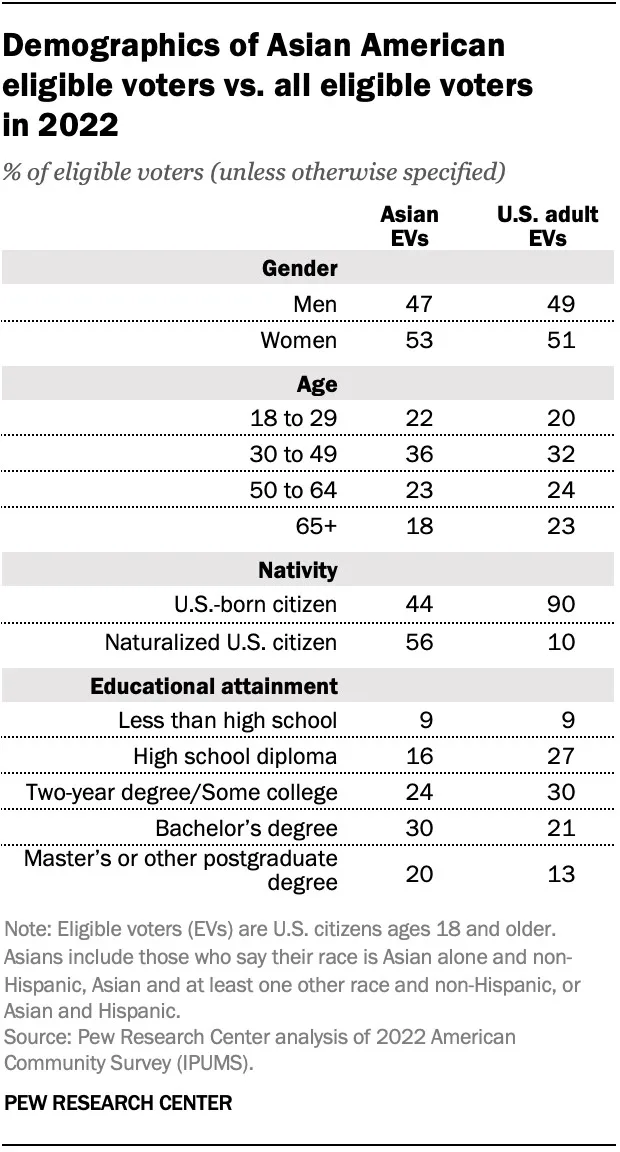
Asian American eligible voters are more likely than the overall eligible voter population to have a bachelor’s degree. As of 2020, half of Asian American eligible voters have a bachelor’s degree or more education. By comparison, a third of all U.S. eligible voters have at least a bachelor’s degree. Asian eligible voters are also more likely than the general eligible voter population to have a postgraduate degree of some kind, such as a master’s degree or law degree (20% vs. 13%).
However, past Center analyses indicate that educational attainment varies widely across Asian origin groups in the U.S.
Asian American eligible voters have relatively high levels of educational attainment. About four-in-ten Asian eligible voters (41%) are ages 50 and older. Meanwhile, about half of all U.S. eligible voters are (48%).