

Data on Minnesota Exports for Second Quarter 2025 – Published September 2025
For More Information: Mary Haugen ([email protected])
- Minnesota’s exports of goods (including agriculture, mining and manufacturing) declined to $5.8 billion in the second quarter 2025, tumbling 19% since the second quarter of 2024.
- The state’s exports were most impacted by the massive drop in mineral fuel, oil sales – down $703 million, or down 96% – without which Minnesota exports would have fallen 10%.
- U.S. exports grew 6% during this period. State trends were split, with half of states having gains.
- U.S. businesses continued to face changing national tariff policies on imports and exports.
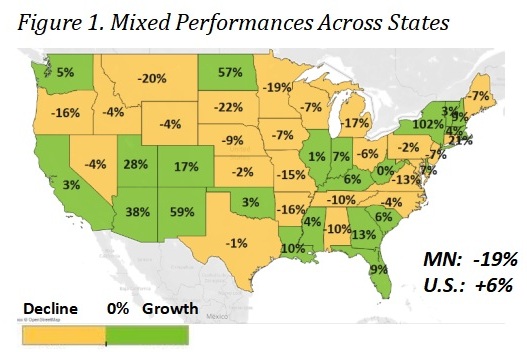
Figure 1. Mixed Performances Across States
Brighter Trends in Europe and Latin America, But Weaker Trends Elsewhere
- Exports dropped to North America($2.1 billion, down 37%), as sales sank to both Canada (down 45%) and Mexico (down 22%). For Canada, the driving force was mineral fuels, for which it is also the state’s primary market. Across North America, exports fell by over $100 million for each vehicles and machinery
- Minnesota exports to Asia ($1.6 billion) slipped 8%. While demand slid in China (down 21%), Taiwan (down 33%) and the Philippines(down 37%), it grew in India (up 32%), Thailand (up 18%) and Singapore (up 16%).
- European markets outside the European Union($329 million, up 37%) and Caribbean, Central America and South America markets ($366 million, up 12%) offered key positive performances. High growth markets in these regions included the K. (up 52%), Switzerland (up 24%), Chile (up 116%) and Brazil (up 16%). Exports to European Union markets ($1.1 billion) grew modestly, by 1%.
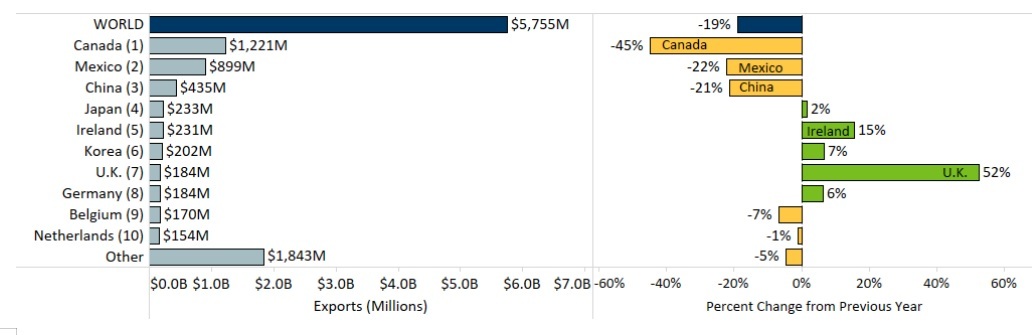
Figure 2. Export Trends for Minnesota’s Top 10 Markets, Second Quarter 2025
Widespread Slump Among Major Product Categories, Growth in Limited Areas
- Significant downward trends in major products – led by mineral fuel, oil(down 96%), machinery (down 17%), vehicles (down 28%), optic, medical (down 8%), stone, plaster, cement (down 62%) – depressed exports.
- Exports ofmineral fuel, oil ($29 million; including motor fuel) plunged $703 million to Canada
- Sales of machineryand vehicles struggled in North America and China. Segments such as vehicle and engine parts; special purpose and passenger vehicles; centrifuges and filters; and computers fell the most.
- While exports of optic, medicalgoods declined to markets in Asia and North America, they rallied and strongly expanded in multiple European markets, including Germany (up 22%) and Switzerland (up 68%).
- The steep decline in stone, plaster, cement exportswas triggered by abrasive products (down $33 million).
- On the bright side, electrical equipment; pharmaceuticals;dairy, eggs, honey; albumin, starch, glue; and oil seeds, misc. grain turned in strong performances.
- Diversified markets for electrical equipmentspurred export growth. They included the K. (up 132%) and Ireland (up 44%) in Europe; Singapore (up 92%) and Korea (up 82%) in Asia; and Brazil (up 167%). Electric generators (up 38%), batteries (up 34%) and insulated wires, cables (up 14%) jumped the most in value.
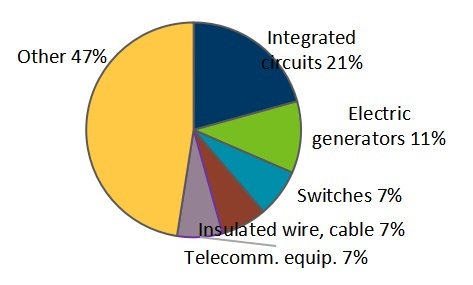
Figure 3. Electrical Equipment Exports
- Robust export growth in pharmaceuticals($78 million, up 41%) was fueled by immunological products ($61 million, up 86%) – particularly to Ireland ($26 million, up 142%) and the U.K. ($10 million, up 854%).
- Sales of dairy, egg, honey($53 million, up 53%) grew briskly to Canada (up 619%, based on demand for fresh chicken eggs), while aircraft, spacecraft exports were uplifted by Germany (up 80%) and Brazil (up 111%).
- Mexico($52 million, up 25%) bolstered exports of oil seeds, misc. grain ($99 million, up 15%; largely soybeans) while India ($6 million, up from $813,000) and Germany ($10 million, up 102%) drove export gains in albumins, starches, glue products (such as for concentrated whey proteins and other protein derivatives).
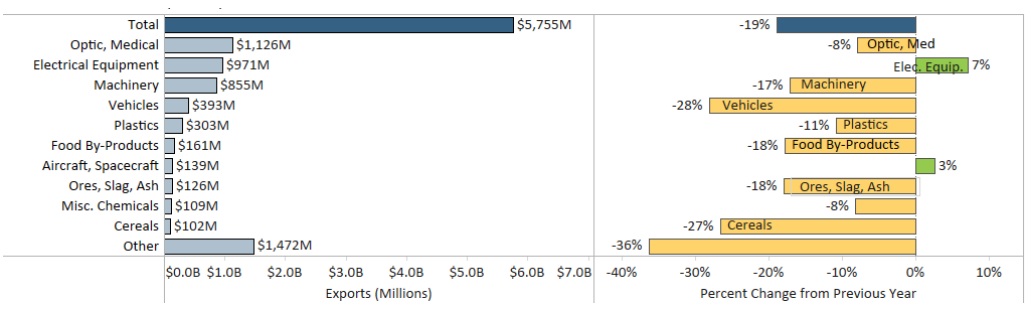
Figure 4. Export Trends for Minnesota’s Top 10 Products, Second Quarter 2025
| Minnesota Export Statistics reports track the state’s trends in exports of goods and is prepared for the Minnesota Trade Office by DEED’s Economic Analysis Unit (Thu-Mai Ho-Kim). The quarterly and annual reports primarily cover export data based on the Harmonized Tariff System (Schedule B), collected by the Foreign Trade Division, Census Bureau, U.S. Dept of Commerce and accessed through USA Trade Online (Census Bureau) and Trade Data Monitor (TDM). Historical reports are available on DEED’s website at “Export and Trade Statistics” (http://mn.gov/deed/data/export-stats/). |