

Annual Data on Minnesota Manufactured Exports – Published in February 2025For More Information: Mary Haugen ([email protected]) |
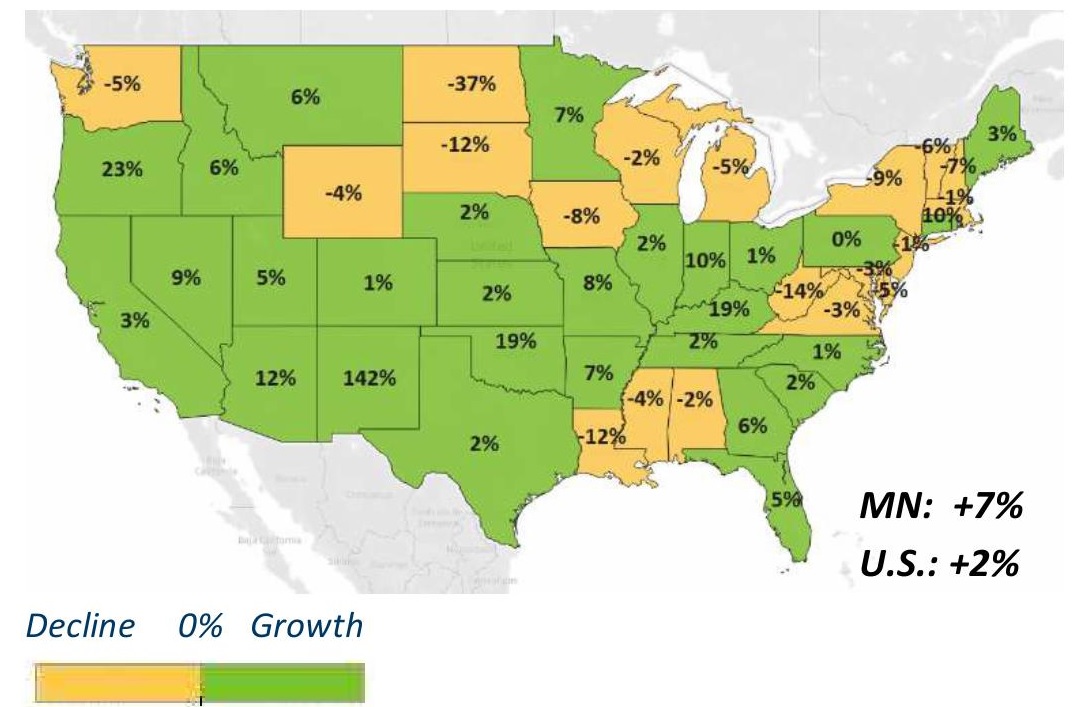
- Minnesota exported nearly $27 billion in agricultural, mining and manufactured goods to about 200 countries in 2024. The state’s exports increased 7% overall between 2023 and 2024 – exceeding U.S. export growth of 2% in the same period. Exports grew for 30 states in 2024.
- Minnesota ranked 13th highest in export growth and 23rd highest in export value among all states.
- The resurgence of Minnesota’s mineral fuel and oil exports to Canada – which jumped $1.2 billion – bolstered the state’s export gains in 2024.
- Exports of goods and services from over 8,100 Minnesota exporters supported about 118,100 jobs in the state in 2022.
Figure 1. Export Gains for Majority of States
Surges in Demand in North America and Asia Drove the State’s Export Growth
- Minnesota exports performed strongly in 2024, exhibiting a reversal to the previous year’s decline.
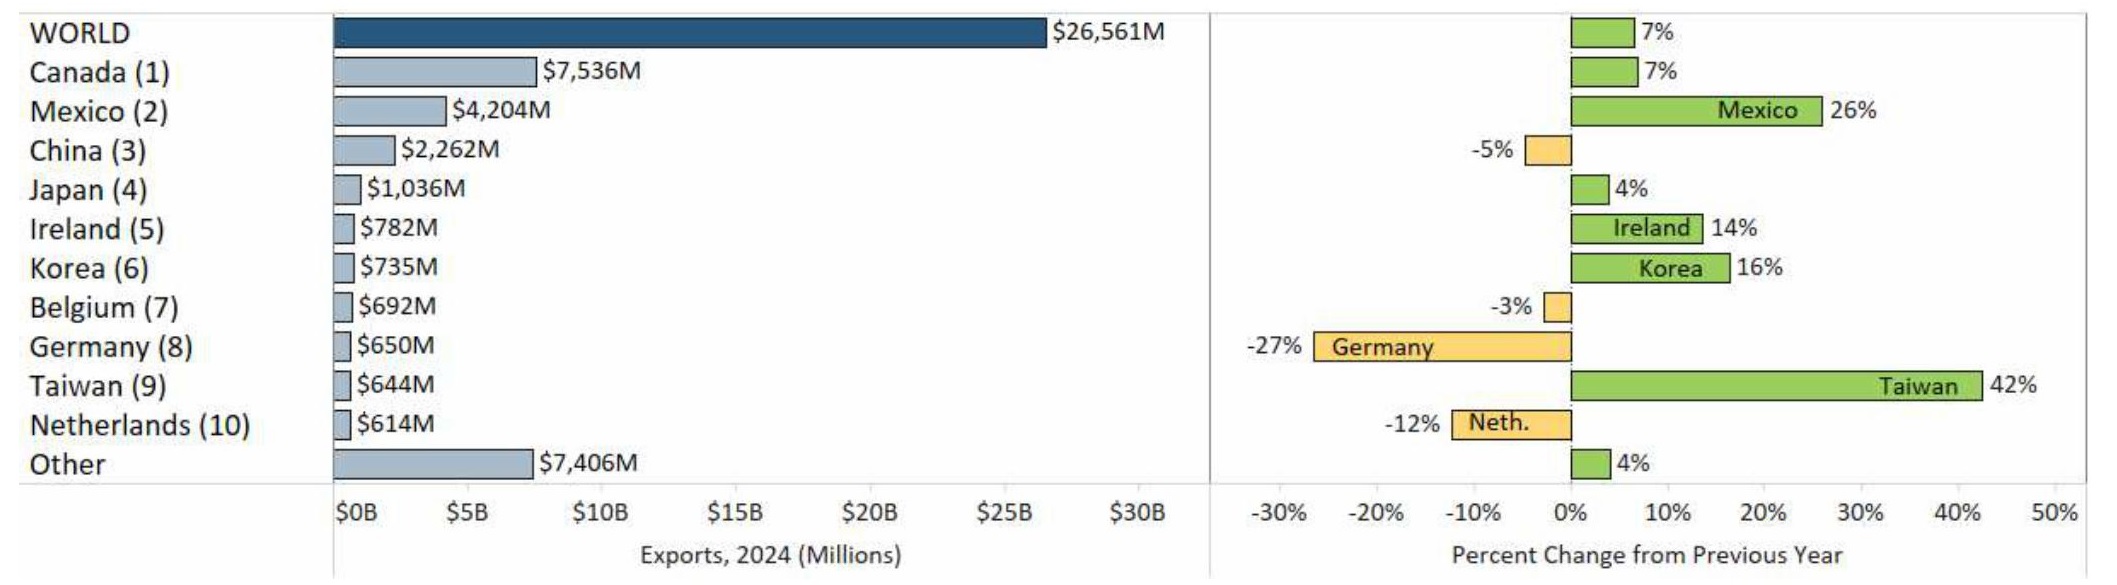
- Exports to North America grew 13% to $11.7 billion, driven by both Canada and Exports also swelled to Asia ($7 billion, up 8%) and the Middle East ($577 million, up 24%).
- While exports increased the most to established markets such as Mexico, Canada, Taiwan, Thailand and Korea, they also grew vigorously to emerging export markets such as UAE, Qatar and Vietnam.
- Minnesota’s sales edged up to the Caribbean, Central America and South America region ($1.4 billion, up 1%), but lost ground in the European Union ($4.1 billion, down 7%), the Australia-Pacific region ($601 million, down 2%) and Africa ($208 million, down 21%).
Figure 2. Exports to Minnesota’s Top 10 Markets in 2024
Mineral Fuel & Oil, Optical & Medical, Plastics and Sugar Exports Grew Strongly
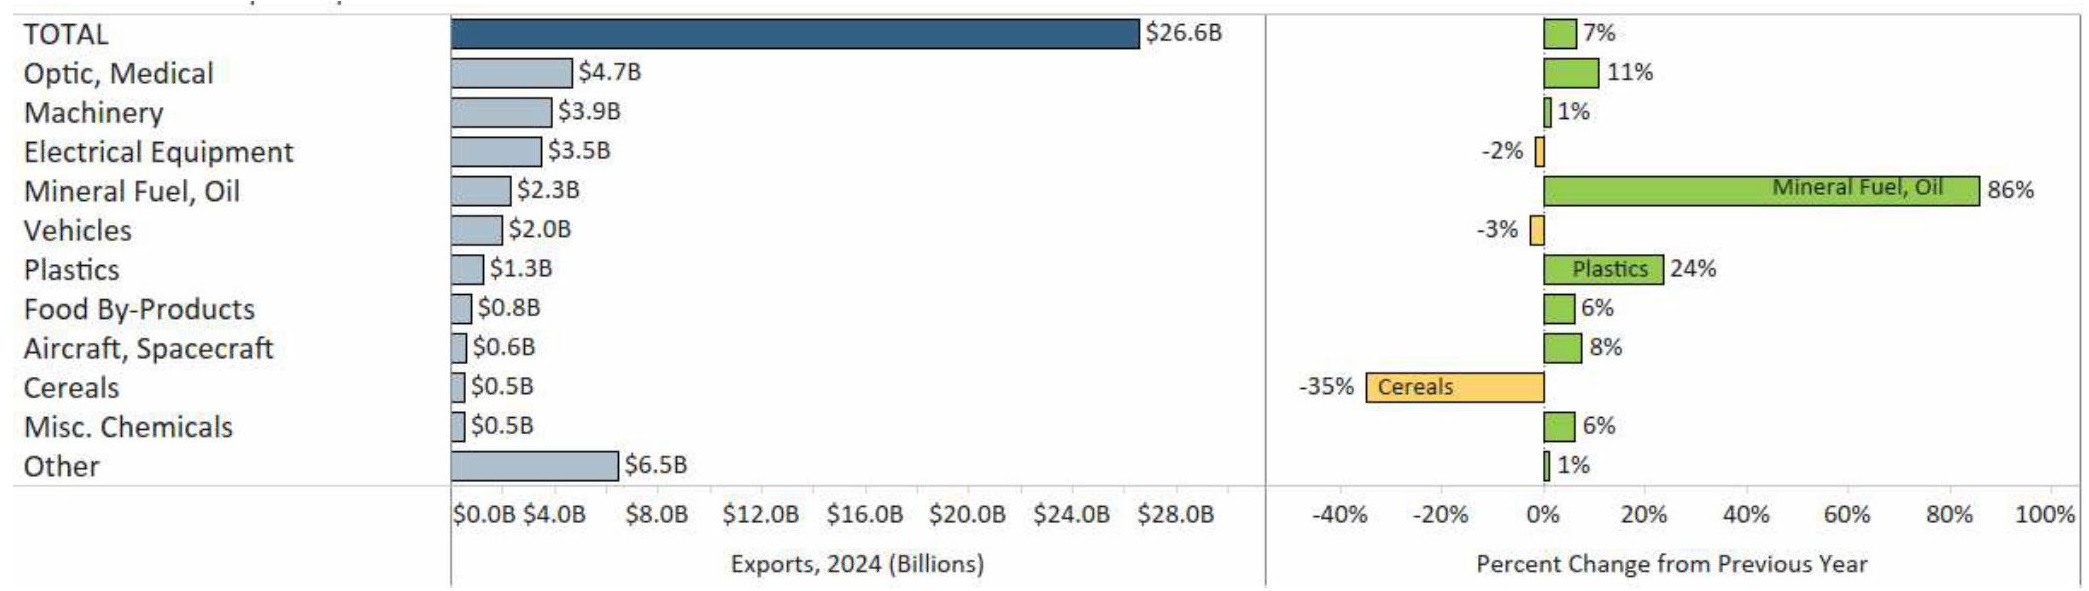
- Global sales of Minnesota’s mineral fuel, oil (up $1.1 billion), optical, medical (up $463 million), plastics (up $243 million) and sugar (up $80 million) products surged in 2024.
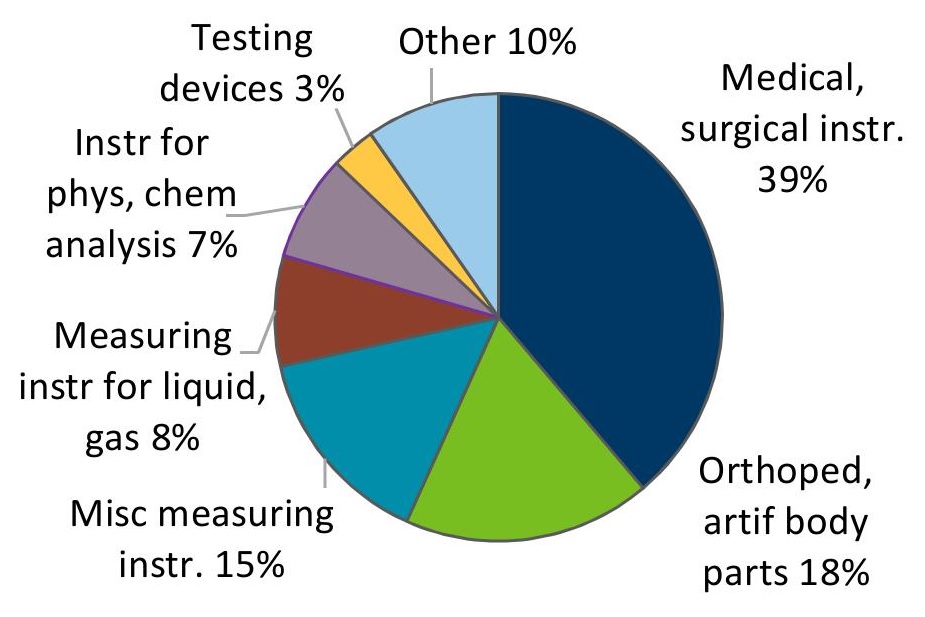
- Exports of mineral fuel, oil products (including motor fuels) jumped 122% to Canada – the state’s dominant market for these goods.Exports of optical, medical goods grew a robust 11% – led by strong performances in Taiwan, Mexico, Korea and China. Miscellaneous measuring instruments and medical, surgical instruments exports gained the most in 2024.
Figure 3. Optical, Medical Exports, by Type
- Plastics reversed some of the decline of recent years with export growth of 24%. Expanding segments included tubes, pipes (up 76%), polyacetals, other polyethers (up 24%) and self-adhesive plates, sheets (up 31%). High-growth markets included Mexico, Costa Rica, Ireland and
- Exports of sugar products ($174 million, up 85%) were propelled by Mexico ($136 million, up 178%).
- Other high-performing food and agricultural exports included food by-products ($759 million, up 6%), oil seeds, misc. grains ($340 million, up 14%), prepared cereal, flour ($212 million, up 16%), beverages ($200 million, up 15%) and edible ingredients ($105 million, up 27%).
- Trends in machinery exports were mixed: sales surged to Mexico (up $129 million), Japan (up $57 million), Qatar (up $56 million), and UAE (up $38 million) but weakened in Canada, Chile, China and Saudi Arabia.
- Sales of vehicles slipped 3% as gains to Mexico (up 23%) were offset by declines to Canada (down 17%).
- Exporters of aircraft, spacecraft (up 8%) branched out to Brazil, France, Sweden, Turkey and Nepal while those of chemicals (up 6%) continued to succeed in China, which accounted for half of these exports.
- In contrast, exports of cereals (largely wheat and corn) tumbled 35% as sales sank in Canada and
Figure 4. Exports of Minnesota’s Top 10 Products in 2024
| Minnesota Export Statistics tracks the state’s trends in exports of goods and is prepared for the Minnesota Trade Office by DEED’s Economic Analysis Unit (by Thu-Mai Ho-Kim). The quarterly and annual reports primarily cover export data based on the Harmonized Tariff System (Schedule B), collected by the Foreign Trade Division, Census Bureau, U.S. Dept of Commerce and accessed through USA Trade Online (Census Bureau) and Trade Data Monitor (TDM). Historical reports are available on DEED’s website at “Export and Trade Statistics” (http://mn.gov/deed/data/export-stats/). The U.S. Department of Agriculture (USDA) publishes alternate agricultural export data based on different methodology. USDA estimated that Minnesota exported $10 billion in ag and food products in 2022 and ranked 4th highest among states. The International Trade Administration estimates jobs supported by U.S. exports of goods and services, while the Census Bureau collects data on the number of identified exporters. Export data on services industries are limited; Minnesota’s services exports were estimated at $12 billion in 2022 by the Coalition of Services Industries. |